
Type 2 Diabetes

Check a food’s likely blood sugar impact while you shop

Scan the barcode with Bite Insight, a free app for UK supermarket food, and check the glycemic impact rating, from Low to Very High. UK labels don’t have to show GI, so the app estimates how fast a food may raise blood sugar from the label’s sugars, carbs and fibre. It’s per 100g, so allow for your portion.

Food shopping with diabetes
is harder than it should be

Manufacturers are not hiding anything. But they are not making it easy either. Sugar alone has over 56 different names on a food label.

0
Names for sugar on food labels

Glucose syrup, maltodextrin, dextrose, fructose. Sugar hides behind dozens of names and you would need to memorise them all to catch every one.

0
People in the UK living with diabetes

The majority have Type 2. Most read food labels several times on every shopping trip and still aren’t sure they are making the right call.

0
Of packaged foods contain added sugar

Even products marketed as healthy, natural, or low fat often contain more sugar than you would expect. The front of pack rarely tells the full story.

Quick guide

How to check a food’s blood sugar impact in the aisle

UK food labels don’t have to list GI, and carbs aren’t part of the front-of-pack traffic lights. That leaves you doing sums next to the shelf. The app can do them for you, or you can check the pack by hand.

With Bite Insight

Let the app do the sums

  1. Set your profile to Diabetic

    Do it once when you sign up, or later in settings. There’s one Diabetic option rather than separate type 1 and type 2 choices. Once it’s set, glycemic impact is usually the first rating you see after a scan, with sugar and carb load beside it.

  2. Scan the barcode

    Point your phone at the barcode and you get a rating from Low (green) to Very High (red), worked out from the label’s figures per 100g. Sugar pushes the rating up most and fibre brings it down. Fibre is optional on UK labels, so if a product doesn’t list it, the rating can come out higher than it should.

Scan your first product free
Your glycemic impact rating
  • Low
  • Moderate
  • High
  • Very High

Worked out per 100g, so allow for your portion.

Checking the pack yourself

Four checks on the back of the pack

Look at total carbohydrate

Diabetes UK says to look at total carbohydrate rather than just the ’of which sugars’ line. It includes starchy foods like bread and pasta as well as sugar, and it’s usually on the back of the pack. Bite Insight’s carb load rating uses the same figure per 100g, on its own scale rather than an official one.

Scale it to what you’ll eat

Figures are per 100g. Diabetes UK’s example is rice at 77.4g of carbohydrate per 100g as sold, so 80g of uncooked rice has 61.9g. Check whether the label means cooked or uncooked, because the weight changes a lot once rice, pasta or potatoes are cooked. Diabetes UK says portion size can affect blood sugar more than GI does.

Read the ingredients for added sugar

The sugars figure includes fruit and milk sugars. The ingredients list shows the added ones, like glucose syrup, dextrose, maltodextrin and honey, plus refined starches such as white flour and modified starch.

Pick the one with more fibre

If two products look alike, Diabetes UK suggests going for the higher fibre one. Fibre is optional on UK labels, so some packs won’t list it.

Low GI isn’t a free pass

Diabetes UK notes that chocolate can be low GI because of its fat. Cambridge University Hospitals warns that some low GI carbs are high in fat, salt or sugar, and that a big portion can still raise your blood glucose. Its suggested swaps include wholegrain bread instead of white, and new potatoes instead of a baked potato.

Where each figure sits on a UK label

Total carbohydrate

Where to find it
Nutrition table on the back of the pack, per 100g column
What to look for
The total figure, not ’of which sugars’. Scale it to your portion. There are no official low or high bands for carbs.

Sugars

Where to find it
Front-of-pack traffic light (if shown) and the back table
What to look for
NHS bands per 100g: 5g or less is low (green), over 22.5g is high (red). This is natural and added sugar together.

Fibre

Where to find it
Back table, but only if the maker chose to include it
What to look for
More is better. Use it to choose between two similar products.

Added sugars

Where to find it
Ingredients list
What to look for
Glucose syrup, dextrose, maltodextrin, honey, agave, maple syrup, fruit juice concentrate

Refined starches

Where to find it
Ingredients list
What to look for
White flour, cornflour, modified starch, potato starch, white rice, puffed rice

Glycaemic index (GI)

Where to find it
Not required on UK labels
What to look for
Use an estimate such as Bite Insight’s glycemic impact rating, or general lower-GI swaps like wholegrain bread for white.
Under the hood

How Bite Insight works this out

Glycemic impact is Bite Insight’s own estimate. It doesn’t look up a GI value. It weighs the sugars, total carbohydrate and fibre per 100g on the label, with sugar counting most and fibre bringing the score down, then sorts the result into Low, Moderate, High or Very High. Those bands are the app’s own and don’t line up with the GI scale, where Diabetes UK counts 55 or below as low.

Bite Insight gives general food information, not medical advice. Glycemic impact is an estimate, not a measured GI. If you’ve just been diagnosed, talk to your GP or diabetes care team about what to eat, especially if you take insulin or other glucose-lowering medicine. Diabetes UK suggests asking your GP about a referral to a dietitian.

Built around your condition

Bite Insight does not give everyone the same results. Set your diabetes profile once and every scan is filtered through your specific needs.

Glycemic Impact Very High

Glycemic impact indicator

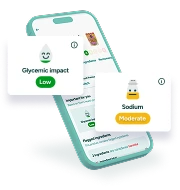
Every scan shows a Low, Moderate, High, or Very High glycemic impact rating. Know at a glance how a product is likely to affect your blood sugar before it goes in the basket.

Limit
Sugar
18g/100g High
Carbohydrates
32g/100g Moderate

Personalised warnings

Tell Bite Insight you have Type 2 diabetes and it flags ingredients that may be relevant to your condition. Hidden sugars, high GI carbohydrates, and items on your watch list. Every single scan.

Flag feature preview, decorative

Flag ingredients to avoid

plus

Add specific ingredients to your personal avoid list. Glucose syrup, maltodextrin, dextrose. Bite Insight will highlight them automatically every time they appear in a scanned product.

Feature spotlight

Know how food will affect your blood sugar

The glycemic impact indicator is built specifically for people managing blood sugar. It analyses the carbohydrate profile of every product you scan and gives you an instant, easy to read signal.

Low impact Unlikely to cause a significant blood sugar rise
Moderate impact Worth being mindful of portion size
High impact Likely to raise blood sugar. Proceed with care
Very high impact A significant blood sugar spike is likely
Glycemic impact indicator showing low impact level

From scan to confidence in seconds

No more squinting at labels in the supermarket aisle.

Scanning a food product barcode with a smartphone

Scan the label

Point your camera at any food barcode or label. In the supermarket, at home, or eating out.

Bite Insight app showing personalised nutrition breakdown

Get your insights

Bite Insight checks the ingredients against your diabetes profile and surfaces what matters. Glycemic impact, hidden sugars, and any personal warnings.

Making a confident, informed food choice

Shop with confidence

Make food decisions that are right for you, not based on guesswork or generic label claims.

Real experience

“I was diagnosed with Type 2 diabetes a couple of years ago and food labels still catch me out. Bite Insight helps me spot hidden sugars quickly, especially in things that look healthy. I don’t feel judged using it. It just gives me the information I need to make better choices.”

Glenn

Type 2 diabetesFounder of Bite Insight

Start free. Upgrade when you’re ready.

The core tools for managing diabetes are completely free. Glycemic impact, personalised warnings, and full nutritional breakdowns on every scan.

Select a version

Everything you need to start making safer, more informed food choices with diabetes.

Bite Insight includes

Glycemic impact indicator Low, Moderate, High, Very High

Personalised warnings based on your diabetes profile

Full nutrition and ingredient breakdown on every scan

200,000+ UK food and drink products including popular restaurants

Free

No subscription or payment details required.

Get the free app

Extra tools for people who want deeper control over what goes in their basket.

Bite Insight+ includes

Flag specific ingredients to always avoid
Family profiles so you can scan for others too
Global barcode scanning
Access to over 4.9 million products worldwide
Plan your meals for the week with the meal planner
Plus everything in the Free version
£3.99/ month

Subscription renews automatically. Cancel anytime.

Upgrade to Bite Insight+

Common questions

About using Bite Insight with diabetes.

Scan the barcode with Bite Insight and look at the glycemic impact rating, which runs from Low to Very High. UK labels don’t have to show GI, so the app estimates blood sugar impact from the sugars, carbohydrate and fibre per 100g on the label. It’s free to use. If you’d rather check by hand, look at total carbohydrate on the back of the pack and scale it to your portion. You can also ask your GP about a referral to a dietitian.

Not exactly. GI has its own scale, and Diabetes UK counts 55 or below as low. Bite Insight doesn’t look up GI values. It estimates how quickly a product may raise blood sugar from the label and uses its own bands, so Low isn’t a GI number. Neither tells the whole story. Diabetes UK says portion size can matter more than GI, and that chocolate can be low GI because of its fat.

Yes. Choose Diabetic in your health profile during onboarding, or update it any time in settings. Every scan then filters its results through your condition, highlighting hidden sugars, flagging high glycemic ingredients, and showing you a glycemic impact rating for the product.

The glycemic impact indicator rates each scanned product as Low, Moderate, High, or Very High based on its likely effect on blood sugar levels. It’s worked out from the sugars, total carbohydrate and fibre on the label, per 100g. This gives you a simple, clear signal at the point of purchase without needing to do the maths yourself.

Bite Insight shows you the full sugar and carbohydrate breakdown for every product you scan, making it easy to compare options. With Bite Insight+, you can also flag specific ingredients like glucose syrup, maltodextrin, or dextrose so they are automatically highlighted whenever they appear in a product. No memorising required.

Bite Insight is primarily designed around the dietary needs of people with Type 2 diabetes, but the detailed nutritional breakdowns, carbohydrate counts, and glycemic impact indicators are valuable for anyone managing their blood sugar. This includes people with Type 1 diabetes who are counting carbs for insulin dosing.

No. Bite Insight provides educational food insights to help you make more informed choices at the point of purchase. It is not a substitute for advice from your GP, diabetes care team, or registered dietitian. Always follow the guidance of your healthcare provider and use Bite Insight as a tool to support that care, not replace it.